Algorithms for processing of brightness fields
| a) | Correction for atmospheric transparency changes We use for this procedure the intensity of light in the center of the solar disk, registered during the measurements of the chosen area. Ik=I(x, y)*Is(0)/Is(t)
Ik(x,y) corrected intensity value in the point (x,y)I(x,y) measured intensity value in the point (x,y) Is(t) light intensity in the center of solar disk in the time of actual measurement in the point (x,y) Is(0) light intensity in the center of solar disk at the beginning of measurement |
| b) | Correction for the limb darkening Using the method of a rolling straight line we lead an envelope through all data of each individual scanned line in such a way that none of the measured values occurs above this straight line. These envelopes belonging to individual lines form a reference intensity surface Ir(x,y), against which the contrast C(x,y) is estimated: C(x,y) = Ir(x,y) - Ik(x,y) For an easy comparison of different photograms we introduce a normalized contrast CN(x,y): CN(x,y) = IrN{1 - [Ik(x,y)]/[Ir(x,y)]}, where IrN represents the standard level, independent on the coordinates x,y; in our case we use IrN = 10000. |
| c) | Correction for the scattered light The use of contrast enables a simple correction for the scattered light: Csc(x,y) = CN(x,y)*CNmax/CN(x,y)max Csc(x,y) - contrast corrected for the scattered light CNmax - requested value of the maximal contrast in the point of maximal measured contrast CN(x,y)max |
| d) | Photospheric isodensity curves It is advantageous to use for the drawing of photospheric isodensity curves the values of the normalized contrast, because the quantization level neariest to zero - describing a considerable part of the photosphere - is well definable. On the contrary, the change of a scale by the quantization of intensity values may caused large, although topologically insignificant effects. |
Signal from the channel of Doppler velocities is proportional to the angle of turning of the planparallel plate of the compensator. Thanks to the small deviation from linearity we may express the Doppler velocity Dr(x,y) for the case of our compensator using the relation
| K = | S | I1(x,y) / | S | I2(x,y) |
| (x,y) | (x,y) |
Methodology of the magnetic field computation
| a) | Calibration of the magnetograph The calibration is made always at the beginning of each measurement. It means that we register signals from all channels measuring the circular polarization and the channels dark currents. Than we calculate the calibration coefficient KC: KC = (IC - IOC)/(VC - VOC) * ZC/Zm VC, IC - calibration signals during the measurement of circular polarisation IOC, VOC - dark currents in channels V and I during the calibration mode ZC, Zm - amplifications in channel V during the modes of calibration and measurement |
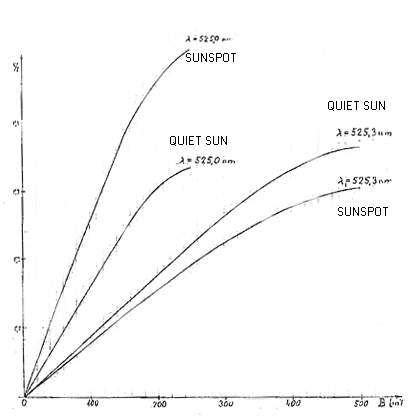
| b) | Computation of magnetic induction On the base of a characteristic of the solar atmosphere Staude (Bachmann et al., 1975) derived the interdependence between the Stokes parameters V and I and the magnetic induction. We calculate first for each point in the measured area the parameter V/I: V/I = KC*[V(x,y) - VOm] / [I(x,i) - IOm] V(x,y), I(x,y) - signals of channels V and I in the measured point VOm, IOm - dark currents in the channels V and I during the mode of measurement Using the numerical calculation, following the derived dependences, we establish the longitudinal component of magnetic field. We delineate the area of a sunspot - which differs from the surrounding photosphere - on the base of evaluation of the field of the normalized contrast CN, we obtained from the values of the Stokes parameter I in the proper wing of the spectral line. |
| c) | Correction of the zero position Evaluation of magnetic fields from both wings of the spectral line leads to slightly different results, caused by the line asymmetry and by the influence of the light linear polarization in the telescope. For the clearing of this effect three methods have been used: c-1) Polarity mode (P) Measuring the magnetic field intensity from both wings of the spectral line we shift the zero position in such a way that the number of points in both polarities is the same. c-2) Magnetic field averaging mode (M) We calculate the magnetic field strength for both wings of the spectral line independently. than the resulting field we obtain by averaging the intesity values of both wings in each poit of the measured area. c-3) Signal averaging mode (S) In each point of the scanned area we average the signals of channels V and I from both wings of the line and the mean values of the calibration constant. Our experience demonstrates that the resulting data sets, obtained by different modes of zero correction, do not differ almost at all. From practical reason we use mostly the most rapid correction, the mode S. |
 |