B.Valníček, V.Letfus, M.Blaha, Z.Švestka and Z.Seidl
BULLETIN OF THE ASTRONOMICAL INSTITUTES OF CZECHOSLOVAKIA, Vol. 10, No 5, 1959
General Conception
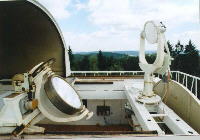
At the construction of the Ondřejov flare spectrograph we aimed to fulfil the following necessary conditions:
(a) The dispersion must be of the order of 1 A/mm.
(b) The photographed spectrum has to cover lines of the Balmer series, some helium lines, H and K lines and some important multiplets of iron and other metals.
(c) More parts of the spectrum must be taken simultaneously.
(d) The spectrograph has to enable the observer to get a series of spectra in short time-intervals to cover the whole development of flares.
(e) The focal image of the Sun must be as large as possible to enable the distinguishing of fine details in the flare structure. On the other hand, the exposures must be shorter than one second to diminish the influence of air disturbances as much as possible.
(f) The spectrograph must be in close connection with visual flare patrol to be able to catch the most interesting premaximum and maximum phases of the flare development.
These requirements were fulfilled in the following way:
(a) The dispersion in 5 spectral regions is the same and equals 1 A/mm, in 2 remaining UV regions it is 0.67 A/mm.
(b) Generally there are two alternatives: either to expose broad regions of the spectrum on long sections of film as has been done by Michard [8] for instance, or to restrict oneself to small portions of the spectrum only, with the most interesting spectral lines, using photographic plates. We chose the second alternative for three main reasons: firstly, it is much easier to form a perfect image of a short spectral region than to focus a broad part of the spectrum with a satisfactory dispersion; secondly, the emulsion on plates is generally more homogeneous and thus enables more precise photometric work; and, in the third place, due to to the change of intensity along the solar spectrum, it is rather difficult to get the correct density along the whole spectral region photographed on a long section of film.
The selected spectral regions include the following important lines:
Plate 1 6503 - 6623 A includes the H-alpha line of hydrogen
Plate 2 5829 - 5949 A includes the D lines of sodium and the D3 line of helium
Plate 3 4797 - 4917 A includes the H-beta line of hydrogen
Plate 4 4277 - 4397 A includes the H-gamma line of hydrogen, 5 lines of the 41-st multiplet of Fe I, 3 lines of the 27-th multiplet of Fe II, and 10 line of the 44-th multiplet of Ti I
Plate 5 3870 - 3990 A includes the H-epsilon and H-ksi lines of hydrogen, the H and K lines of Ca II, 3964.7 A line of He I, 3905.5 A line of Si I, 9 lines of the 4-th multiplet of Fe I, 5 lines of the 20-th multiplet of Fe I, both lines of the first multiplet of Al I, and all 8 lines of the 15-th multiplet od Ti I
Plates 6 and 7 3640 - 3814 A include the higher Balmer lines from H(10) up to the series limit, 12 lines of the 5-th multiplet of Fe I, 2 lines of the 14-th multiplet of Ti II and 2 lines of the 3-rd multiplet of Ca II.
(c) The focal image of the Sun has a mean diameter of 125.6 mm. In different spectral regions 1 mm of the vertical
scale of the spectrum corresponds to 17.3" up to 23.6" on the solar disc. The exposure time varies beetween
1/25 and 1 second for plates Nos. 1-5 and 5 to 10 seconds for plates Nos. 6 and 7, according to the height of the Sun
above the horizon, the transparency of the air, and the seeing conditions. Full PDF here